The Confidence of Investors
Investors are increasingly becoming interested in the future potential of SDB bank, rather than its past performance. As a result, non-financial information – information not captured in the balance sheets – is becoming more and more relevant for ascertaining the Bank’s future potential. Accordingly, we have enhanced our disclosures of non-financial information in this integrated annual report which will provide clarity on the Bank’s path into the future and contribute towards investor confidence.
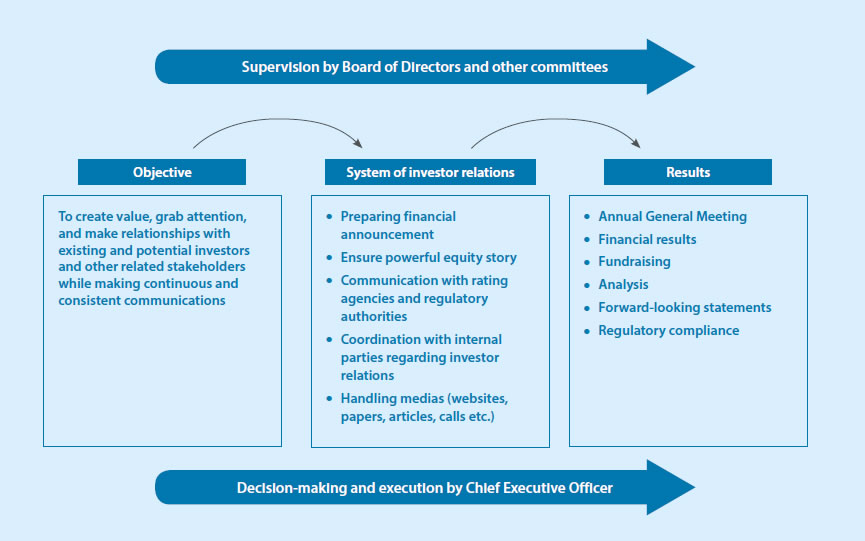
Consisting of dialogue between SDB bank and the financial markets, investor relations comprises information that helps the investment community make judgements about the Bank’s market value vis-a-vis its potential and sustainability. The feedback received from investors and the market also provides valuable insight to the Bank in strategic decision-making.
We ensure active investor engagement so that the market is able to make sound decisions on their current and probable future shareholdings and investments in other securities.
The Annual General Meeting is SDB bank’s primary platform for communicating the Bank’s performance. The Annual Report gives detailed, yet succinct information on its activities, use of its different forms of capital and its responsible social capital involvement. In addition, the Bank has one-on-one interactions with significant investors and releases other publications through the Colombo Stock Exchange.
Using these communications channels, we help investors to gain a balanced view of our operating results, financial position, liquidity and cash flow through the Financial statements. In addition, available disclosures help investors get a reasonable understanding of the Bank’s strategic direction, governance, risk management, and the future business prospects.
By sharing these many facets of information, we expect current and potential investors to gain a better understanding of the value of the Bank and to build and strengthen their relationship with SDB bank.
Accountability, transparency, and good governance remain at the forefront of our operations and the emphasis placed on these aspects in our communications with our investors give them the confidence that the operations are being conducted in line with best practices from around the world.
Our investor relations programme is designed to achieve the following:
- A competitive price for the Bank’s shares;
- A healthy level of transactions of the Bank’s shares on the stock exchange;
- Easier and cheaper access to capital in the future; and
- Reduced volatility in the share price through maintaining a loyal group of investors.
At SDB bank, we believe that successful investor relations are achieved through regular exchange of information with the market. As a result, such interactions remain integral to our communication strategy.
SDB bank securities
Types
- Quoted ordinary shares
- Debentures
Listing details
Quoted ordinary shares
Listed exchange : Colombo Stock Exchange (CSE) Main Board
Sector : Banks, Finance and Insurance
Quoted date : 31 May 2012
Code-ISIN : LK0412N00003
Stock symbol : SDB.N000
Debentures
| Type | Code | ISIN | Par value LKR | Coupon
rate
(Per annum) % |
Credit rating |
| B | SDB-BD-31/12/20-C2337-10 | LK0412D23394 | 100 | 10.00 | A+(SO) |
| D | SDB-BD-31/12/20-C2339-10.30 | LK0412D23378 | 100 | 10.30 | A-(SO) |
Credit ratings
The Bank has obtained credit ratings from Fitch Ratings Lanka Ltd., and ICRA Lanka Limited. The ratings take into consideration the Bank’s performance, asset quality, capitalisation, liquidity and market position among others.
| Rating entity | Rating |
| Fitch Ratings Lanka Ltd. | BB+(lka) with Stable outlook |
| ICRA Lanka Limited | (SL)BBB- with Stable outlook |
Useful links for investors
| Information | Link (website) |
| SDB Bank | www.sdb.lk |
| Colombo Stock Exchange | www.cse.lk |
| Central Bank of Sri Lanka | www.cbsl.gov.lk |
| Fitch Ratings Lanka Ltd. | www.fitchratings.com |
| ICRA Lanka Limited | www.icralanka.com |
How we create value
Shares and shareholders’ analysis
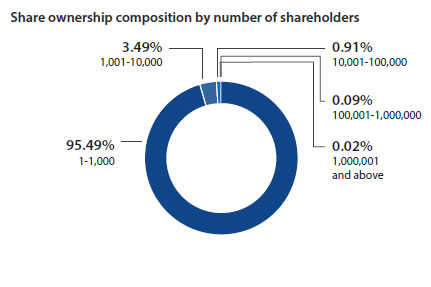
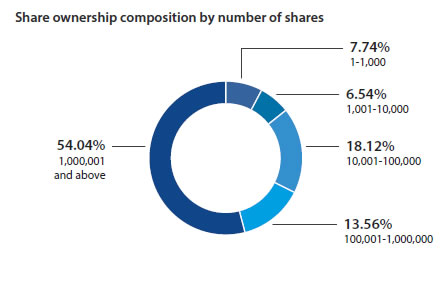
Share ownership composition
| Share range | 31 December 2019 | 31 December 2018 | |||||||||
| Number of shareholders | % | Number of shares | % | Number of shareholders | % | Number of shares | % | ||||
| 1 | – | 1,000 | 35,813 | 95.49 | 4,358,723 | 7.74 | 36,003 | 95.63 | 4,404,185 | 7.82 | |
| 1,001 | – | 10,000 | 1,312 | 3.49 | 3,684,299 | 6.54 | 1,286 | 3.42 | 3,556,285 | 6.32 | |
| 10,001 | – | 100,000 | 341 | 0.91 | 10,200,329 | 18.12 | 313 | 0.83 | 9,447,858 | 16.78 | |
| 100,001 | – | 1,000,000 | 32 | 0.09 | 7,634,895 | 13.56 | 38 | 0.10 | 8,607,818 | 15.29 | |
| 1,000,001 | – | and above | 8 | 0.02 | 30,430,006 | 54.04 | 8 | 0.02 | 30,292,106 | 53.79 | |
| 37,506 | 100.00 | 56,308,252 | 100.00 | 37,648 | 100.00 | 56,308,252 | 100.00 | ||||
Analysis of shareholders
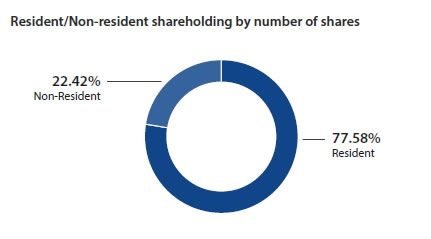
Resident/Non-resident
| 31 December 2019 | 31 December 2018 | ||||||||
| Number of shareholders | % | Number of shares | % | Number of shareholders | % | Number of shares | % | ||
| Resident | 37,491 | 99.96 | 43,684,393 | 77.58 | 37,632 | 99.958 | 43,693,059 | 77.596 | |
| Non-resident | 15 | 0.04 | 12,623,859 | 22.42 | 16 | 0.042 | 12,615,193 | 22.404 | |
| Total | 37,506 | 100.00 | 56,308,252 | 100.00 | 37,648 | 100.00 | 56,308,252 | 100.00 | |
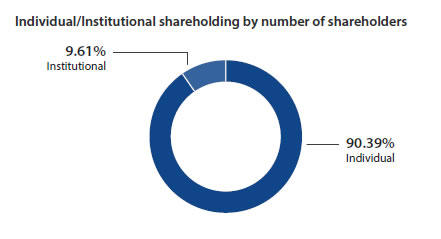
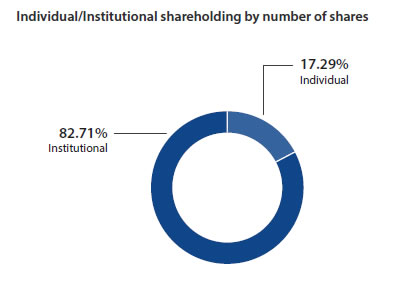
Individual/Institutional
| 31 December 2019 | 31 December 2018 | ||||||||
| Number of Shareholders | % | Number of shares | % | Number of shareholders | % | Number of shares | % | ||
| Individual | 33,901 | 90.39 | 9,735,164 | 17.29 | 34,060 | 90.47 | 16,516,455 | 29.33 | |
| Institutional | 3,605 | 9.61 | 46,573,088 | 82.71 | 3,588 | 9.53 | 39,791,797 | 70.67 | |
| Total | 37,506 | 100 | 56,308,252 | 100 | 37,648 | 100 | 56,308,252 | 100 | |
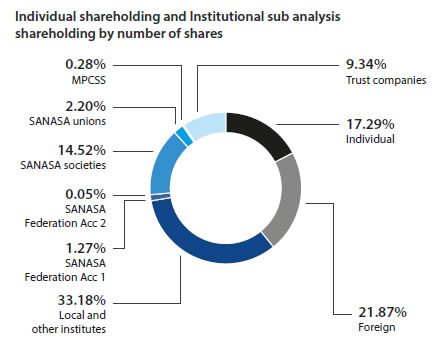
Institutional subanalysis
| 31 December 2019 | 31 December 2018 | ||||||||
| Number of Shareholders | % | Number of shares | % | Number of shareholders | % | Number of shares | % | ||
| Foreign | 4 | 0.011 | 12,308,428 | 21.87 | 4 | 0.010 | 12,289,797 | 21.83 | |
| Local and other institutions | 46 | 0.122 | 18,681,731 | 33.18 | 50 | 0.133 | 11,847,519 | 21.04 | |
| Sanasa Federation | |||||||||
| Acc 1 | 1 | 0.002 | 720,024 | 1.27 | 1 | 0.002 | 720,024 | 1.27 | |
| Acc 2 | 28,439 | 0.05 | 28,439 | 0.05 | |||||
| Sanasa societies | 3,394 | 9.049 | 8,176,835 | 14.52 | 3,372 | 8.957 | 7,047,079 | 12.52 | |
| Sanasa unions | 34 | 0.091 | 1,241,252 | 2.20 | 35 | 0.093 | 1,242,645 | 2.21 | |
| MPCCS | 21 | 0.056 | 156,595 | 0.28 | 21 | 0.056 | 156,595 | 0.28 | |
| Trust companies | 105 | 0.279 | 5,259,784 | 9.34 | 105 | 0.279 | 6,459,699 | 11.47 | |
| Total | 3,605 | 9.610 | 46,573,088 | 82.71 | 3,588 | 9.530 | 39,791,797 | 70.67 | |
Top twenty shareholders
| No. | Name of the shareholder | 31 December 2019 | 31 December 2018 | ||
| Number of shares | % | Number of shares | % | ||
| 1. | Ayenka Holdings (Pvt) Ltd. | 7,028,043 | 12.48 | 6,779,840 | 12.04 |
| 2. | Seylan Bank PLC/Senthilverl Holdings (Pvt) Ltd.* | 6,952,168 | 12.34 | 6,936,510 | 12.32 |
| 3. | SBI Emerging Asia Financial Sector Fund PTE. LTD | 5,045,636 | 8.96 | 5,045,636 | 8.96 |
| 4. | CB NY S/A International Finance Corporation | 4,991,644 | 8.86 | 4,991,644 | 8.86 |
| 5. | Nederlandse Financierings Maatschappij Voor Ontwikkelingslanden N.V. | 2,242,504 | 3.98 | 2,242,504 | 3.98 |
| 6. | People’s Leasing & Finance PLC | 2,094,012 | 3.72 | 2,094,012 | 3.72 |
| 7. | Kegalle SANASA Shareholders Trust Company Limited | 1,039,330 | 1.85 | 1,039,330 | 1.85 |
| 8. | SANASA General Insurance Company Limited | 1,036,669 | 1.84 | 1,162,630 | 2.06 |
| 9. | SANASA Life Insurance Company Ltd. (Life) | 910,708 | 1.62 | 910,708 | 1.62 |
| 10. | Sampath Bank PLC/Dr T Senthilverl | 871,885 | 1.55 | 871,885 | 1.55 |
| 11. | Sanasa Federation Ltd. | 720,024 | 1.28 | 720,024 | 1.28 |
| 12. | Polgahawela Sanasa Societies Union Ltd. | 387,314 | 0.69 | 387,314 | 0.69 |
| 13. | Hambanthota DTCCS Union Ltd. | 384,257 | 0.68 | 384,257 | 0.68 |
| 14. | Dr T Senthilverl | 373,598 | 0.66 | 373,598 | 0.66 |
| 15. | Mr D P Pieris | 257,067 | 0.46 | 257,067 | 0.46 |
| 16. | Kotikawatta Thrift and Credit Co-operative Society Limited | 253,896 | 0.45 | – | – |
| 17. | Polgahawela SANASA Shareholders Trust Company Ltd. | 240,836 | 0.43 | 238,667 | 0.42 |
| 18. | Sampath Bank PLC/Mr Arunasalam Sithampalam | 224,333 | 0.40 | 224,333 | 0.40 |
| 19. | Dr S Yaddehige | 205,653 | 0.37 | 205,653 | 0.37 |
| 20. | Kamburupitiya City SANASA Society Ltd. | 181,209 | 0.32 | 181,209 | 0.32 |
| Total | 35,440,786 | 62.94 | 35,046,821 | 62.24 | |
* Shares held by Seylan Bank PLC/Dr Thirugnanasambandar Senthilverl has been transferred to the Seylan Bank PLC/Senthilverl Holdings (Pvt) Ltd. on 17 June 2019.
| 31 December 2019 | 31 December 2018 | |||
| Number of shares | % | Number of shares | % | |
| Total number of shares registered | 48,763,197 | 86.60 | 48,686,639 | 86.46 |
| Total number of shares unregistered | 7,545,055 | 13.40 | 7,621,613 | 13.54 |
| Total number of shares issued | 56,308,252 | 100 | 56,308,252 | 100 |
| Shares held by Directors and CEO | 199,450 | 0.35 | 75,243 | 0.13 |
| Shares held by institutions | 46,573,088 | 82.71 | 39,791,797 | 70.67 |
| Balance held by others | 9,535,714 | 16.94 | 16,441,212 | 29.20 |
| Total number of shares issued | 56,308,252 | 100 | 56,308,252 | 100 |
| Shares held by public | 56,107,533 | 99.64 | 56,231,740 | 99.86 |
| Shares held by Directors, CEO and related parties | 200,719 | 0.36 | 76,512 | 0.14 |
| Total number of shares issued | 56,308,252 | 100.00 | 56,308,252 | 100.00 |
Market capitalisation and minimum public holding
| 31 December 2019 | |
| Market capitalisation (LKR) | 3,598,097,303 |
| Public holding percentage | 99.64 |
| Float adjusted market capitalisation | 3,585,271,359 |
| Number of shareholders representing public holding | 37,500 |
| Required minimum public holding percentage under option 4 of Rule 7.13.1 (a) of the Listing Rules of the CSE (%) | 10 |
The minimum public holding requirement of the Bank as at 31 December 2019 complied with under option 4 of Rule 7.13.1 (a) of the Listing Rules of the CSE.
Directors’ and CEO’s shareholding
| Name | 31 December 2019 | 31 December 2018 | ||
| Number of shares | % | Number of shares | % | |
| Ms S Kiriwandeniya (Chairperson) | 5,785 | 0.0103 | 5,785 | 0.0102 |
| Mr P Subasinghe (Director) | 69,341 | 0.1231 | 69,341 | 0.1231 |
| Mr K G Wijerathne (Director) | 117 | 0.0002 | 117 | 0.0002 |
| Mr B R A Bandara (Director) | 3,791 | 0.0067 | – | – |
| Mr Thilak Piyadigama (CEO) | 120,416 | 0.2139 | – | – |
| Total | 199,450 | 0.3542 | 75,243 | 0.1335 |
Share trading details
Market share trading
| 2019 | 2018 | 2017 | 2016 | 2015 | |
| Number of transactions | 1,197,205 | 885,657 | 981,977 | 1,056,849 | 1,506,790 |
| Number of shares traded (Mn.) | 9,855 | 6,001 | 8,468 | 7,196 | 9,415 |
| Annual turnover (LKR Mn.) | 171,407.96 | 200,068.84 | 220,591.24 | 176,935.45 | 253,251.01 |
| Average daily turnover (LKR Mn.) | 711.23 | 833.62 | 915.43 | 737.23 | 1,059.63 |
SDB bank share trading
| 2019 | 2018 | 2017 | 2016 | 2015 | |
| Number of transactions | 3,065 | 4,392 | 5,981 | 10,940 | 26,889 |
| Number of shares traded | 9,548,518 | 11,169,042 | 4,830,202 | 5,649,252 | 19,891,297 |
| Value of shares traded (LKR Mn.) | 579.51 | 1,199.97 | 500.47 | 725.61 | 2,667.29 |
| Average daily turnover (LKR Mn.) | 2.51 | 5.06 | 2.08 | 3.02 | 11.16 |
Market capitalisation details
CSE and banking industry market capitalisation
| 2019 | 2018 | 2017 | 2016 | 2015 | |
| CSE market capitalisation (LKR Bn.) | 2,851.31 | 2,839.44 | 2,899.29 | 2,745.00 | 2,938.00 |
| S & P SL20 (31/12) | 2,936.96 | 3,135.18 | 3,671.72 | 3,496.44 | 3,625.69 |
| All share price index (31/12) | 6,129.21 | 6,052.37 | 6,369.26 | 6,228.26 | 6,894.50 |
| Banking, finance and insurance sector market capitalisation (LKR Bn.) |
757.32 | 784.24 | 769.97 | 653.86 | 699.84 |
SDB bank market capitalisation
| 2019 | 2018 | 2017 | 2016 | 2015 | |
| CSE market capitalisation (LKR Bn.) | 2,851.31 | 2,839.44 | 2,899.29 | 2,745.00 | 2,938.00 |
| SDB bank market capitalisation (LKR Bn.) | 3.59 | 4.22 | 5.58 | 4.36 | 6.32 |
| Increase/decrease in market capitalisation of SDB bank (%) | -15 | -24 | 28 | -31 | 84 |
| SDB bank market capitalisation as a percentage of CSE market capitalisation (%) |
0.13 | 0.15 | 0.19 | 0.16 | 0.22 |
| Market capitalisation rank of SDB bank | 117 | 91 | 83 | 96 | 78 |
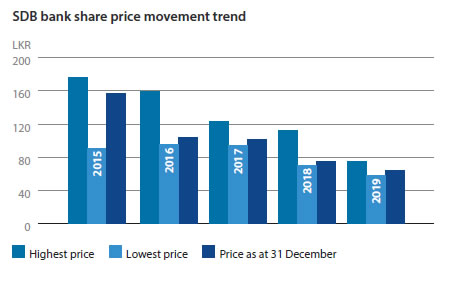
Share price movement
| 2019 | 2018 | 2017 | 2016 | 2015 | |
| Highest price (LKR) | 75.00 | 112.90 | 122.50 | 158.80 | 176.00 |
| Lowest price (LKR) | 58.00 | 70.00 | 93.80 | 95.20 | 91.00 |
| Price as at 31 December (LKR) | 63.90 | 75.00 | 101.90 | 103.70 | 157.10 |
Dividends
A dividend is a distribution of reward, from a portion of the Bank’s earnings, and is paid to the ordinary shareholders annually. The amount declared and paid each year varies in relation to the earnings of the Bank. It strikes a balance between a fair return to the shareholders for their investment and the business requirements to maintain the sustainability of the Bank.
Dividends are decided and managed by the Bank’s Board of Directors and they are approved by the shareholders through the exercise of their voting rights.
| Year | Profit for the year LKR Mn. | Total cash dividend paid/ to be paid LKR Mn. | Dividend per share LKR | Dividend
payout ratio % |
Dividend
yield % |
| 2015 | 720.57 | 109.16 | 10.00 | 55.86 | 6.37 |
| 2016 | 403.72 | 131.24 | 7.50 | 78.13 | 7.23 |
| 2017 | 507.82 | 136.94 | 6.00 | 60.79 | 5.89 |
| 2018 | 356.95 | – | – | – | – |
| 2019 (To be paid) | 253.41 | 112.62 | 7.00 | 155.55 | 10.95 |
Value delivered to shareholders
CSE market
| 2019 | 2018 | 2017 | 2016 | 2015 | |
| Market price-earnings ratio (PER) (Times) | 10.83 | 9.65 | 10.60 | 12.37 | 17.98 |
| Market price to book value (PBV) (Times) | 1.14 | 1.18 | 1.31 | 1.42 | 1.99 |
| Market dividend yield (DY) (%) | 3.17 | 3.09 | 3.19 | 2.75 | 2.18 |
Banking industry
| 2019 | 2018 | 2017 | 2016 | 2015 | |
| Market price-earnings ratio (PER) (Times) | 5.57 | 5.38 | 6.61 | 7.04 | 11.02 |
| Market price to book value (PBV) (Times) | 0.84 | 0.92 | 1.07 | 1.15 | 1.44 |
| Market dividend yield (DY) (%) | 2.70 | 2.80 | 2.50 | 3.30 | 3.00 |
SDB bank
| 2019 | 2018 | 2017 | 2016 | 2015 | |
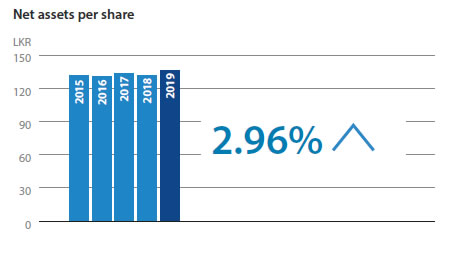
| Net asset value per share (LKR) | 136.20 | 132.28 | 133.83 | 131.22 | 131.62 |
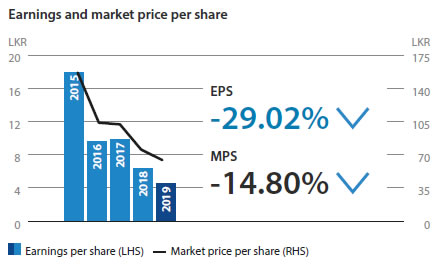
| Basic earnings per share (LKR) | 4.50 | 6.34 | 9.87 | 9.60 | 17.90 |
| Dividend per share (LKR) | 7.00 | – | 6.00 | 7.50 | 10.00 |
| Market price per share as at 31 December (LKR) | 63.90 | 75.00 | 101.90 | 103.70 | 157.10 |
| Price-earnings ratio (PER) (Times) | 14.20 | 11.83 | 10.32 | 10.80 | 8.78 |
| Price to book value (PBV) (Times) | 0.47 | 0.57 | 0.76 | 0.79 | 1.19 |
| Dividend yield (DY) (%) | 10.95 | – | 5.89 | 7.23 | 6.37 |
| Dividend payout (%) | 155.55 | – | 60.79 | 78.13 | 55.86 |
| Number of shares (Mn.) | 56.31 | 56.31 | 54.78 | 42.06 | 40.25 |
| Number of shareholders | 37,506 | 37,648 | 38,283 | 39,374 | 40,283 |
| Total equity (LKR Mn.) | 7,668.98 | 7,448.73 | 7,331.16 | 5,519.28 | 5,297.35 |
| Stated capital (LKR Mn.) | 5,921.54 | 5,921.54 | 5,758.69 | 4,062.96 | 3,794.09 |
| Debt to equity (Times) | 12.77 | 11.83 | 10.09 | 10.75 | 10.12 |
| Interest cover (Times) | 1.06 | 1.08 | 1.11 | 1.13 | 1.34 |
| Return on equity (%) | 3.35 | 4.83 | 7.90 | 7.46 | 14.42 |
| Earnings growth (%) | (9) | (14.41) | 22 | (43.97) | 42.84 |
| Quick assets ratio (%) | 0.59 | 0.65 | 0.63 | 0.65 | 0.55 |
Other information for ordinary shareholders
Record of scrip issue
| Year | New proportion | Old proportion | Number of shares listed | Date listed |
| 2017 | 1 | 22.8533 | 2,279,147 | 12 June 2017 |
| 2018 | – | – | – | – |
| 2019 | – | – | – | – |
Record of rights issue (2014)
| Code | Close price LKR | Highest price LKR | Lowest price LKR | Turnover LKR | Number of shares | Trades |
| SDB.R0000 | 15.00 | 24.00 | 10.70 | 31,153,089.00 | 2,191,458 | 1,717 |
| Date of allotment | Number of shares provisionally allotted | Consideration per share LKR | Final allotment number of shares | Amount raised LKR | Proportion | Date issued |
| 18 November 2014 | 12,587,661 | 80.00 | 12,587,661 | 1,007,012,880.00 | 1:2 | 30 December 2014 |
Utilisation of funds raised through rights issue
| Objective Number |
Objective as per circular | Amount allocated as per circular in LKR | Proposed date of utilisation as per circular | Amount allocated from proceeds in LKR | Percentage of total proceeds | Amounts utilised in LKR | Percentage of utilisation against allocation |
| 1 | To increase the Bank’s capital base and to finance portfolio growth whilst strengthening the balance sheet | 1,007,012,880 | Nine months from the date of allotment | 1,007,012,880 | 100 | 1,007,012,880 | 100 |
Value creation for debenture holders
Basic information of the debentures
| Type B | Type D | |
| Tenure | 5 years | 5 years |
| Issue date | 31.12. 2015 | 31.12. 2015 |
| Maturity date | 31.12. 2020 | 31.12. 2020 |
| Frequency of interest payable | Semi-annual | Semi-annual |
| Market value | Not traded | Not traded |
Other information of the debentures
| 2019 | 2018 | |||||||
| Balance as at 31 December LKR ’000 | Coupon rate % | Annual effective rate % | Interest rate of comparable Government Securities % | Balance as at 31 December LKR ’000 | Coupon
rate % |
Annual
effective
rate % |
Interest rate of
comparable
Government
Securities % |
|
| Type B | 422,906 | 10.00 | 10.25 | 9.72 | 422,906 | 10.00 | 10.25 | 11.58 |
| Type D | 591,128 | 10.30 | 10.57 | 9.72 | 591,128 | 10.30 | 10.57 | 11.58 |
Utilisation of funds raised through debenture issue
| Objective Number | Objective as per prospectus | Amount allocated as per prospectus in LKR | Proposed date of utilisation as per Prospectus | Amount allocated from proceeds in LKR | Percentage of total proceeds | Amounts utilised in LKR | Percentage of utilisation against allocation |
| 1 | To raise medium term funds to manage assets and liability mismatch and to minimise the interest rate risk | – | – | – | – | – | 100 |
| 2 | To finance the budgeted lending portfolio (approximately 90% as loans and the balance as leasing) and to minimise the mismatch in funding exposure | 964,560,000 | In the ordinary course business within the next 12 months from the date of allotment |
868,104,000 for loans and 96,456,000 for leasing |
100 | 964,560,000 | 100 |