The Achievement of Financial Goals
The year 2019 was marked as an exigent year for banking industry. Demand for credit, non-performing loans, business volume, moratorium and interest rate caps were the key variables impacted on and which made performance during the year challenging for the industry as a whole. Gross Domestic Product (GDP) growth rate of the country was lower in 2019 than anticipated due to the political and policy uncertainty caused by terror attacks on Easter Sunday. Consequently, Sri Lankan economy showed lower performance in first nine months of 2019, with a growth rate of 2.7%, compared with 3.5% in 2018.
Despite the challenges, SDB bank utilised its capabilities and potentials to grow in a way that puts the customer at the centre by enhancing with customer experiences through service quality and digital improvements, while maintaining strong internal controls and risk management. In this context, the Bank continued to create value through its unique value creation business model, in which stakeholder interest is the key brace of focus and it is the success story behind the Bank’s financial performance.
However, our performance was also strongly influenced by the macroeconomic, competitive and regulatory environments and other material matters identified on pages 34 and 35. Outcomes were also shaped based on how we responded to the market conditions through our strategic actions, our people and our ability to deliver. Together with our capitals, these factors contributed substantively to the Bank’s results. To mitigate the potential risks emanating from the material matters and unlock opportunities, our strategic focus areas,
as described on pages 36 and 37, support delivery of our medium-to-long-term targets.
Detailed analysis of the financial performance along with the key indicators is set out below and this analysis is based on the financial statements prepared in accordance with the Sri Lanka Financial Reporting Standards.
Financial performance
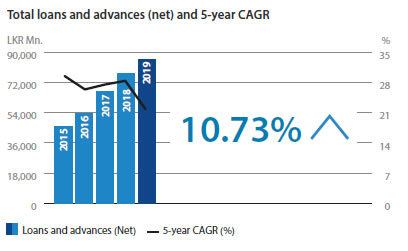
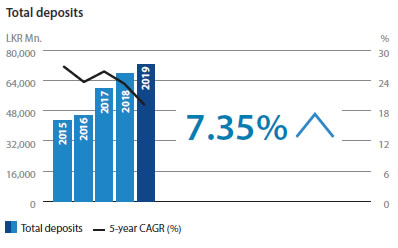
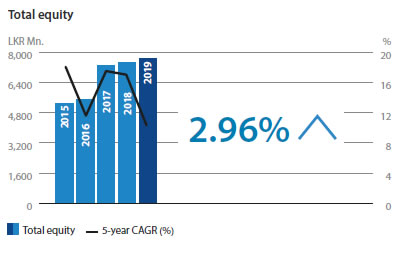
Despite the turbulent environment prevailed in 2019, SDB bank continues to grow its business volume. Total assets of the Bank grew by 11% year-on-year to LKR 107.78 Bn. with growth in loan book (net) by 11% to LKR 85.8 Bn. The loan book picked up in 2019 due to the reasons of strengthening the recoveries, higher business volume and enhancing all our primary and ancillary processes while maintaining and improving risk management and internal controls. Deposits grew by 7% year-on-year to LKR 72.4 Bn. Equity of the Bank stood at LKR 7.67 Bn. as at 31 December 2019. The Bank raised LKR 3.2 Bn. by way of BASEL III compliant – Tier 2 subordinated term debts during the year to strengthen Tier 2 Capital.
The Bank reported a total comprehensive income of LKR 220.25 Mn. for the year 2019 which reflects a decline of 31% over the previous year, owing to impairment provision and debt repayment levy. Nevertheless, the Bank’s total operating profit before impairment and taxes grew by 32% to LKR 2.16 Bn. in 2019 compared to LKR 1.64 Bn. reported in 2018.
Income statement analysis
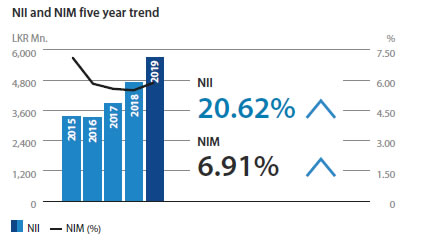
Net interest income (NII)
Net interest income (NII) recorded a growth of 21% year-on-year to LKR 5.69 Bn. from LKR 4.72 Bn. in 2018. The growth was primarily attributable to balance sheet growth of 11% in loans and advances, which is lower than the loan growth recorded in 2018. The interest income grew by 15% to LKR 15 Bn. while the total interest expenses increased by 11% to LKR 9.3 Bn. due to the growth in deposits and borrowings during the year. As a result, the net interest margin (NIM) grew marginally to 5.88% from 5.50% in 2019. The portfolio mix between fixed and floating rate loans was another factor for the Bank to maintain healthy NII and NIM as AWPLR decreased to 9.94% by end of 2019 from 11.92% at the beginning of the year.
Non-interest income
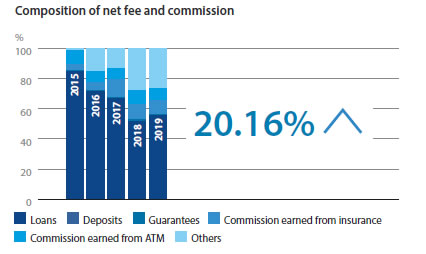
Non-interest income comprises net fee and commission income, net trading income and other operating income. The net fee and commission income are closely linked to transactional banking volumes, which are a function of economic activity and competition for banking services. Net trading income is a function of trading volumes and market volatility which affects trading spreads. Other operating income consists of other banking activity-related revenue, including gains from sale of property, plant and equipment, dividend income and income derived from the Bank assurance agreements.
Net fee and commission income grew by 20% to reach LKR 231 Mn. from LKR 192 Mn. The growth in net fee and commission income was mainly driven due to growth in loan book, as loan processing fee income recorded a growth of 30% to LKR 128 Mn. for the year. Fee and commission income recognised as an emerging source which ended with 3.8% contribution to the total operating indicating potential for future expansion. During the financial year, the Bank made a significant investment in the digital transformation to improve access, navigation and usability for all of our customers across our businesses. The strong expansion in debit cards base and Upay app will lead to customer migration to digital channels and it will further strengthen the fee-based income of SDB bank.
Net gains/losses from trading amounted to a profit of LKR 1.26 Mn., reflecting gain on Government Securities held at end of the year. Gain from financial instruments at fair value through profit or loss narrowed by 59% to LKR 114.9 Mn. Other operating income reflected an increase of 337% compared to the previous year due to the increase in gain on sale of property, plant and equipment and account maintenance fee income by LKR 9.2 Mn. and LKR 59.3 Mn. respectively, in absolute terms. However, total non-interest income declined by 11% to LKR 438.3 Mn., due to decline of gain from financial instruments at fair value through profit or loss.
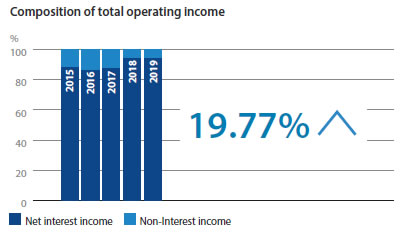
Total operating income
Total operating income grew by 18% to LKR 6.14 Bn. a fruitful achievement to an extent under the given adverse operating conditions. Net-interest income and non-interest income contributed 93% and 7% respectively to operating income and decline in non-interest income was offset by the growth in net-interest income during the year.
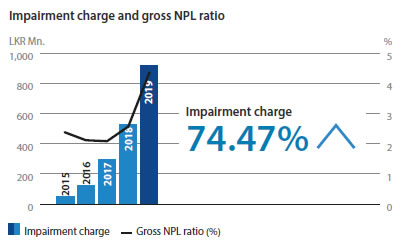
Impairment for loans and other losses
The strained economic conditions that prevailed throughout the year 2019 and Easter Sunday attack continued to affect many businesses in the country. As a result, banking sector witnessed significant increase in customer defaults and delayed repayments. Application of SLFRS 9 and stress arising from drop in credit quality due to delayed repayments increased impairment charges across the banking sector. Consequently, impairment charge for the year increased by 74% to LKR 917 Mn. compared to LKR 525 Mn. in 2018.
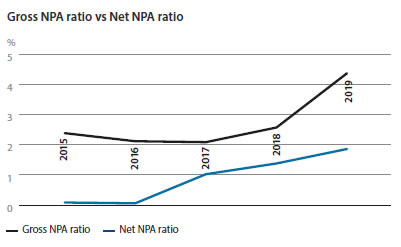
Due to deterioration of credit quality, both the individual and collective impairment increased during the financial year. The gross NPL ratio was 4.38% (2018: 2.56%), which is slightly below the industry average levels. To address this issue, the Bank continued to take strategic steps such as rescheduling and restructuring of existing credit facilities to suit the customer repayment capacity together with improvements to the pre and post credit evaluation protocols.
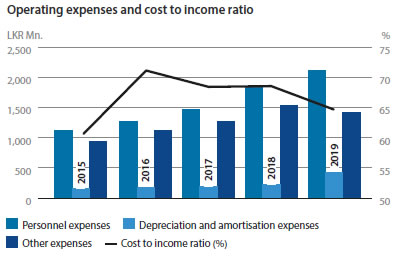
Operating expenses
Bank’s total operating expenses is comprise with personnel expenses, depreciation and amortisation and other expenses inclusive of office administration and establishment expenses. Total operating expenses demonstrated with 11% increment over the last year, this was led by a 16% increase in personnel expenses due to higher personnel cost triggered by second tranche of periodic salary revision made in 2019 and an increased depreciation charge following the implementation of SLFRS 16 and additions to the property, plant and equipment. Total percentage growth in operating expenses remained below the growth in total operating income. As a result, the Bank’s cost to income ratio decreased by 390 bps from 68.61% reported in last year to 64.71% in 2019. It is important to note that the Bank managed to restrict its total operating expenses to well below the budget allocation for 2019.
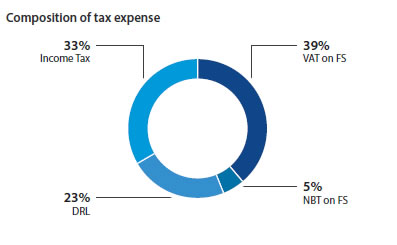
Taxation
The Bank’s total tax contribution comprising VAT on financial services, NBT on financial services, Debt Repayment Levy and income tax, increased by 32% to LKR 996 Mn. during the year. The increase stemmed primarily from the Debt Repayment Levy which was imposed with effect from 1 October 2018. The impact for the year was LKR 226 Mn. compared to LKR 53 Mn. for 2018. Meanwhile Taxes on Financial Services and Income Tax increased by 5% and 16%. respectively.
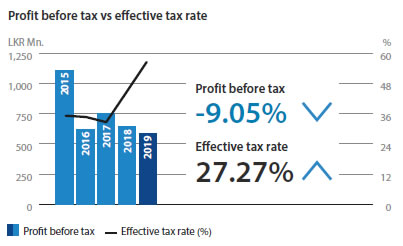
Profitability
Profit before tax decreased to LKR 585 Mn. for the year, narrowed by 9% from LKR 644 Mn. reported in 2018. Apart from the impairment charge, significant increase in taxes on financial services, especially the debt repayment levy resulted in profits declining at pre-tax level. Profit after tax also declined by 29% from LKR 356 Mn. to LKR 253 Mn.
Meanwhile, the Bank’s return on assets and return on equity declined marginally to a respective 0.57% and 3.35%, from 0.72% and 4.83% respectively in 2018.
Other comprehensive income/expenses (OCI)
Other comprehensive expenses amounted to LKR 33.15 Mn. during the year, compared to the expense of LKR 36.5 Mn. in 2018. Therefore, there is a slight reduction by 9%.
After charging other comprehensive expenses, total comprehensive income for the year was LKR 220.25Mn. compared to LKR 320.45 Mn. in 2018.
Financial position analysis
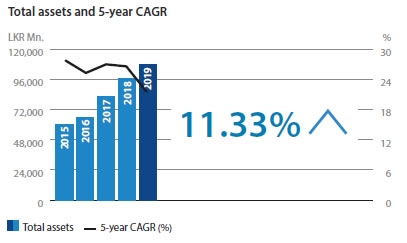
Total assets
The Bank achieved a major milestone during the year, with the total asset base crossing the LKR 100 Bn. mark to end the year at LKR 107.8 Bn. Total assets grew by 11% during the year, driven by growth in loans and advances. Further, the cash and cash equivalents and placements with banks recorded a drop compared with 2018. On the other hand, investment in financial assets recognised through profit or loss and the investment in financial assets classified under amortised cost have increased. Right-of-use assets reported in the Statement of Financial Position is due to the implementation of Sri Lanka Accounting Standard – SLFRS 16 ''Leases''. The corresponding liability is booked under other liabilities. Due to this adjustment, both assets and liabilities of the Bank showed an increase of LKR 651 Mn. in 2019.
Loans and advances
Loans and advances represent the largest asset class on the Bank’s balance sheet, which accounted for 80% of the total assets. It provides the bank’s biggest source of revenue in the form of interest income, and creates cross-selling opportunities to earn transactional fees and insurance-related revenues. Growing loans and advances within the Bank’s accepted risk levels is therefore essential to growing revenue. The net loan portfolio which stood at LKR 77.5 Bn. in 2018, grew by 11% to reach LKR 85.8 Bn. as at 31 December 2019.
Asset quality
Deterioration in asset quality started in the latter part of 2018 continued throughout 2019. As a result, the Bank experienced an increase in its non-performing loans portfolio. However, Bank’s NPA ratio remained below industry for much of 2019 and the robust risk management framework and the strengthened recovery initiatives helped the Bank to contain the increase in the gross NPL ratios to 4.38% as at December 2019 compared to the gross NPL ratios of 2.56%, a year ago.
Total liabilities
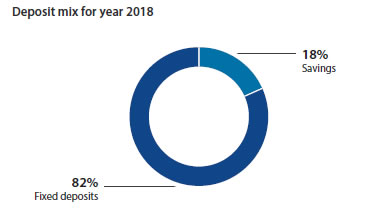
Bank’s total liabilities growth of 12% was driven by deposit growth, subordinated debt and other borrowings. Customer deposits grew by 7% to LKR 72.4 Bn. which accounts for 72% of total liabilities. The Bank raised LKR 3.2 Bn. by way of a Basel III compliant – Tier 2 subordinated debt during the year to strengthen Tier 2 Capital. Bank continued its approach to tap local, long to medium-term borrowing opportunities. This has led to an increase of amounts due to banks by 32% during the financial year 2019. Overall, liability growth has been managed prudently to build a strong balance sheet that will support the future growth aspirations of the Bank.
Equity and compliance with capital requirements
In 2019 the Bank remained proactive in its effort to strengthen the capital base in compliance with Basel III capital requirements. The Bank raised LKR 3.2 Bn. by way of a Basel III compliant – Tier 2 subordinated debt in June and December 2019. As a result, the Bank’s Tier 1 Capital, Total Tier 1 Capital and Total Capital Adequacy Ratios as at December 2019 stood at 9.43%, 9.43% and 14.8% respectively. These ratios stood above the minimum ratios prescribed by Basel III capital requirements.
Liquidity
The Bank maintained its liquidity position within the approved risk appetite and tolerance limits. Appropriate liquidity buffers were held in line with regulatory, prudential and internal stress testing requirements, taking into account the market conditions. Throughout the year the Bank maintained its statutory Liquid Asset Ratio well above the minimum threshold of 20% prescribed by CBSL. Further, the Bank maintained an average Liquidity Coverage Ratio of 123.7% and Net Stable Funding Ratio of 130% which was comfortably in excess of the regulatory minimum requirement of 100%.
Dividends
The Banking industry faced many challenges during the year; both from business and regulatory fronts. The minimum capital requirements became more stringent with the adoption of Basel III. Other factors which affected were the impact on the adoption of the new accounting standards and the introduction of the new tax laws. The Board of Directors after considering all of the above has approved a dividend of LKR 7.00 per share for the financial year 2019 which will be paid in the form of a cash dividend of LKR 2.00 and the balance LKR. 5.00 in the form of scrip dividend subject to the approval of the shareholders at the Annual General Meeting to be held on 15 July 2020.